Accuracy and Precision
In general terms (for the time being…), we may think of accuracy as how far away from the real value your measurements are, and precision as how close your readings are to each other;
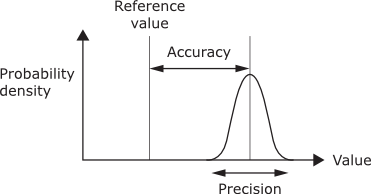
The two concepts are obviously not the same; you can have very precise readings (well-defined, close together) that are very inaccurate (way off the true value), and vice versa;

Poor accuracy tends to reflect systematic errors in an experiment, such as a badly calibrated instrument, for example.
Precision, on the other hand is more related to statistical variation among a set of readings, and between sets of readings (perhaps by different operators, for example). These two factors are termed Repeatability and Reproducibility.
We can consider 5 variables that affect Repeatability and Reproducibility, and therefore Precision:
- The Calibration of the measuring equipment
- The Operator
- The Measurement equipment itself
- The Environmental conditions
- The Time elapsed between measurements
If the five factors above are held constant, then we minimise our variability in measurement, what we refer to as repeatability conditions. If one or more of these factors vary, then we increase the variability of the measurements, and we are then dealing with reproducibility conditions.
ISO 5725
Concepts such as these are formally defined in ISO 5725-1: "Accuracy (trueness and precision) of measurement methods and results - Part 1: General principles and definitions.", p.1 (1994).
However, ISO 5725 introduced the concept of “Trueness”, which replaced the familiar concept of accuracy referred to up till now. In ISO 5725, Fig 1 becomes;
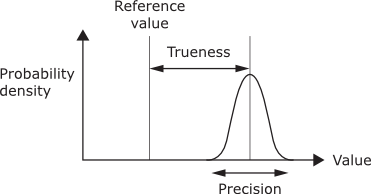
Accuracy is now defined as an all-encompassing term, being a combination of trueness and precision. In other words;

Reading Resolution, Hysteresis and the Human Element
A couple of other concepts are also relevant to this discussion – “Reading Resolution” and “Hysteresis”. Reading Resolution refers to the smallest increment that an instrument will discriminate. We need to note, however, that this is not necessarily the same as display resolution. A poorly designed digital instrument may well be able to display more decimal places than it can effectively measure, leading us to the mistaken impression that the instrument is more accurate than it actually is. This is compounded by the fact that we have a tendency nowadays to believe that digital measurements and “computer-controlled” equipment are automatically more reliable than analogue or manual measurements. In fact, more often than not, the opposite is the case; with an analogue measurement, we have the added advantage that the operator can be far more discriminating in making an educated judgement than they would be by just accepting a number as “true”. “Computers are useless, …” Pablo Picasso is reputed to have once said, “… they can only give you answers”.
Hysteresis is a measure of how well the instrument returns back to the starting point after taking the measurement. (Think about why we tap an old-fashioned barometer to get the “true” reading of atmospheric pressure). It is the basis for what we call “stiction” in some of our experiments (a combination of the words “stickiness” and “friction”).
So, can we ever get a “true” measurement?
Once all these factors are taken into account, it becomes clear that there is rarely a situation where we have an absolutely “true” or “correct” measurement. We can get ever more accurate readings with more elaborate, sophisticated, and therefore more expensive equipment, but this ultimately becomes impractical for our purposes (see the article “A Brief Moment of Inertia” for further discussion of this).
A couple of examples…
Let’s take a couple of examples from our product range to illustrate this;
With our SM1002 Bench Top Tensile Testing Machine, we invite students to investigate applying forces to tensile specimens of various different materials, to observe how the different materials behave, and to confirm the relationship between stress and strain.
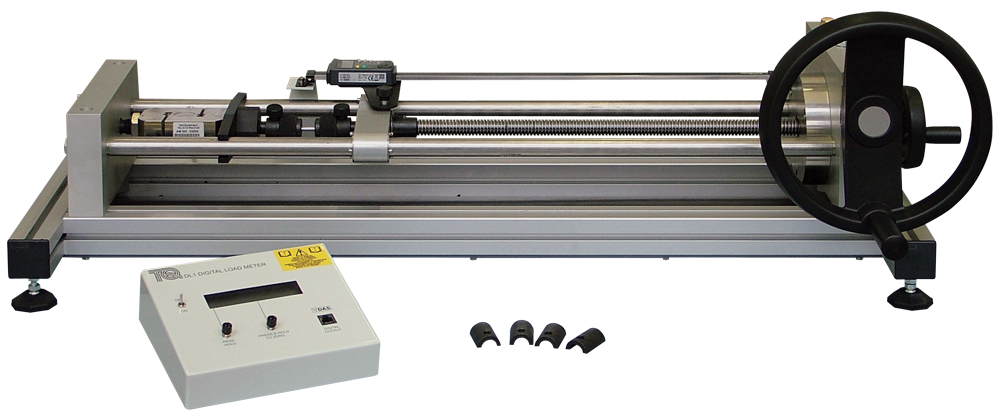
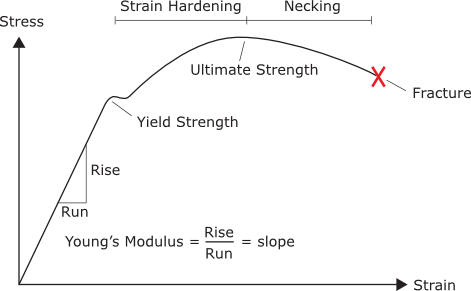
When used with the SM1002a Extensometer (which eliminates the minor distortion of the apparatus itself), we can arrive at a reasonably accurate value for Young’s Modulus, which is the slope of the linear section of the graph, i.e. the ratio of stress over strain in the elastic region;

We are not overly concerned in this experiment whether this calculated value is absolutely correct, what we are concerned with is that the student understands what is going on during the test, and that they understand how Young’s Modulus can be derived. To develop a very precise value for E would take us into the realms of very expensive, industrially certified equipment, very strict quality monitoring of specimens, and statistical analysis over hundreds of data samples. Clearly this would not be tenable for a typical undergraduate Mechanical Engineering course.
Another example comes from our Structures range, the STR8 Pin-Jointed Frameworks. This experiment looks at the distribution of tensile and compressive forces in the elements of a framework, such as a roof truss, for example;
Strictly speaking, these are not true pin joints, but the overall effect of the strain gauges and the joint construction gives realistic results that validate simplified pin joint theory. Again, the objective of this experiment is for the student to develop an understanding of how these structures behave under applied loads, rather than to generate “exact” values of stresses and strains in the framework.
In actual fact, in the real world, we rarely see examples of true pin joints anyway. The structures we see on a day to day basis are typically “I” section beams, connected and reinforced by plates, flanges, etc;

Much of Civil Engineering relies on idealised models such as simplified Pin Joint theory and hefty safety margins, and constructions based on these have stood the test of time.
In short…
Fortunately, for most of our equipment, we are principally concerned with observing the behaviour of a particular system or process. The objective of the experiment being to understand what is going on with the process, and to verify the particular law or theory governing that topic. Rarely are we concerned with ultra-accurate values of particular parameters, so we avoid the need for very expensive measurement systems. Indeed, one of the objectives that we build into experiments is to develop the student’s understanding of all the factors outlined above so that they can understand the various sources of measurement errors.
You will have noticed in many of our manuals, that we pose the question, “How would you improve this experiment so that you could get more accurate results?” In answering this question, and in appreciating the various factors that govern “Accuracy”, students start to make the transition from being just students, to becoming Engineers.

